 Cardiovascular Physiology Concepts, 3rd edition textbook, Published by Wolters Kluwer (2021)
 Normal and Abnormal Blood Pressure, published by Richard E. Klabunde (2013)
Electrocardiogram (EKG, ECG)

General Description
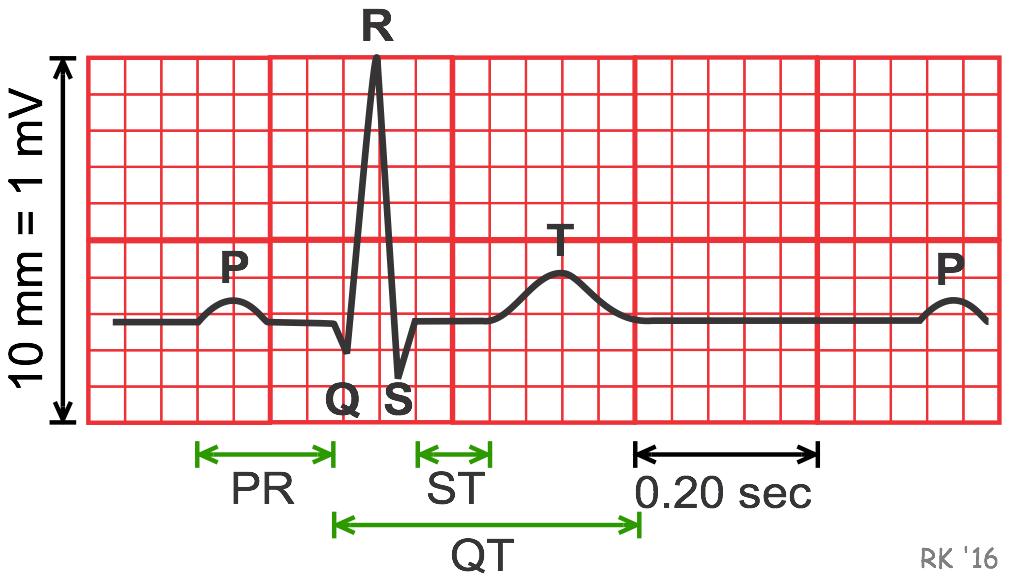 As the heart undergoes depolarization and repolarization, the electrical currents that are generated spread not only within the heart but also throughout the body. This electrical activity generated by the heart can be measured by an array of electrodes placed on the body surface. The recorded tracing is called an electrocardiogram (ECG, or EKG). A typical ECG tracing is shown to the right. The different waves that comprise the ECG represent the sequence of depolarization and repolarization of the atria and ventricles. The ECG is recorded at a speed of 25 mm/sec (5 large squares/sec), and the voltages are calibrated so that 1 mV = 10 mm (2 large squares) in the vertical axis. Therefore, each small 1-mm square represents 0.04 sec (40 msec) in time and 0.10 mV in voltage. Because the recording speed is standardized, one can calculate the heart rate from the intervals between different waves.
P wave (atrial depolarization)
The P wave represents the wave of depolarization that spreads from the SA node throughout the atria and is usually 0.08 to 0.10 seconds (80-100 ms) in duration. The brief isoelectric (zero voltage) period after the P wave represents the time in which the impulse is traveling within the AV node (where the conduction velocity is slowed) and the bundle of His. Atrial rate can be calculated by determining the time interval between P waves. Click here to see how the atrial rate is calculated.
The period of time from the onset of the P wave to the beginning of the QRS complex is termed the PR interval, which normally ranges from 0.12 to 0.20 seconds in duration. This interval represents the time between the onset of atrial depolarization and the onset of ventricular depolarization. If the PR interval is >0.20 sec, there is an AV conduction block, which is called a first-degree heart block if each impulse from the atria can still be conducted into the ventricles.
QRS complex (ventricular depolarization)
The QRS complex represents ventricular depolarization. Ventricular rate can be calculated by determining the time interval between QRS complexes. Click here to see how the ventricular rate is calculated.
 The duration of the QRS complex is normally 0.06 to 0.10 seconds. This relatively short duration shows that ventricular depolarization normally occurs rapidly despite the large mass of the ventricles. If the QRS complex is prolonged (> 0.10 sec), conduction is impaired within the ventricles. This can occur with bundle branch blocks or whenever a ventricular foci (abnormal pacemaker site) becomes the pacemaker driving the ventricle. Such ectopic foci nearly always result in impulses being conducted over slower pathways within the heart, increasing the time required for complete depolarization and, therefore, the duration of the QRS complex.
The shape of the QRS complex in the above figure is idealized. In fact, the shape changes depending on which recording electrodes are being used. The shape also changes when there is abnormal conduction of electrical impulses within the ventricles. The figure to the right summarizes the nomenclature used to define the different components of the QRS complex, as may occur in different ECG recording leads and with abnormal conduction within the ventricles.
ST segment
The ST segment is the isoelectric period following the QRS and ending at the beginning of the T wave. This represents the period at which both ventricles are completely depolarized. This segment roughly corresponds to the plateau phase of the ventricular action potentials. The ST segment is crucial in the diagnosis of ventricular ischemia or hypoxia because under those conditions, the ST segment can become either depressed or elevated.
T and U waves
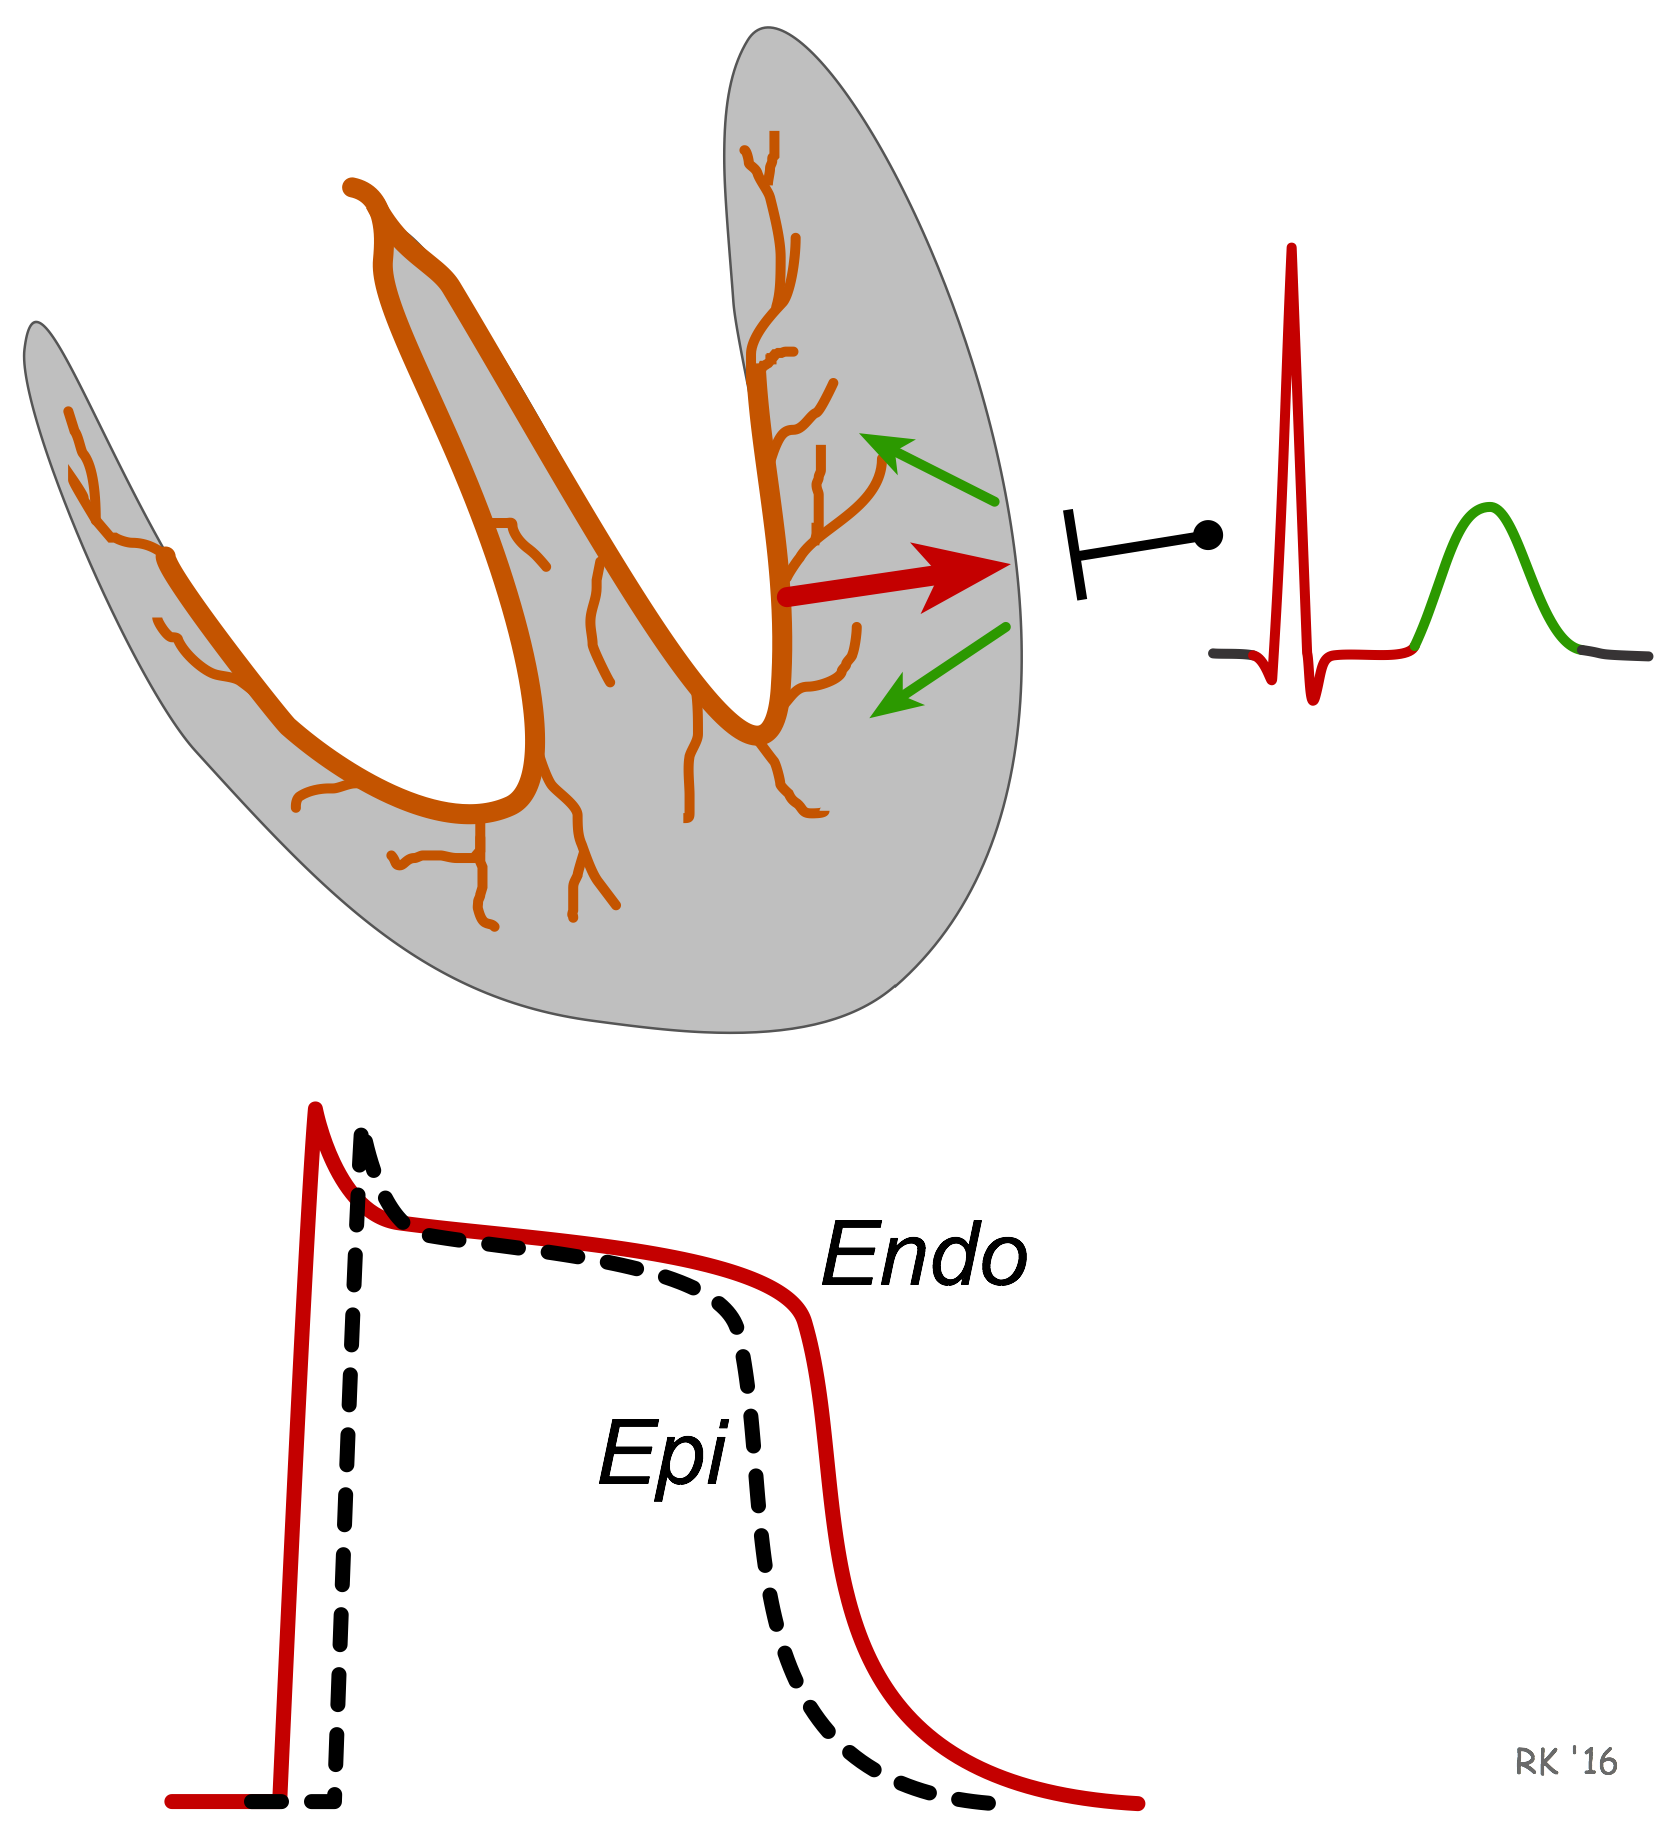 The T wave represents ventricular repolarization. The T wave exhibits a positive deflection. This is because the last cells to depolarize in the ventricles are the first to repolarize. This occurs because the last cells to depolarize are in the subepicardial region of the ventricles, and these cells have shorter action potentials than found in the subendocardial regions of the ventricular wall. Therefore, although the depolarization of the subepicardial cells occurs after subendocardial depolarization, the subepicardial cells undergo phase 3 repolarization before the subendocardial cells. Therefore, repolarization waves generally are oriented opposite of depolarization waves (green versus red arrows in figure), and repolarization waves moving away from a positive recording electrode produce a positive voltage.
The T wave is longer than the QRS complex that represents depolarization. The longer duration occurs because conduction of the repolarization wave is slower than the wave of depolarization. This is because the repolarization wave does not utilize the high-velocity bundle branch and Purkinje system, and therefore primarily relies on cell-to-cell conduction.
Occasionally, a small positive U wave may be seen following the T wave (not shown in figure at top of page). This wave represents the last remnants of ventricular repolarization. Inverted T waves or prominent U waves indicate underlying pathology or conditions affecting repolarization.
QT interval
The QT interval represents the time for both ventricular depolarization and repolarization to occur, and therefore roughly estimates the duration of an average ventricular action potential. This interval can range from 0.20 to 0.40 seconds, depending upon heart rate. At high heart rates, ventricular action potentials shorten in duration, which decreases the QT interval. Because prolonged QT intervals can be diagnostic for susceptibility to certain types of tachyarrhythmias, it is important to determine if a QT interval is excessively long. The QT interval is often expressed as a corrected QT (QTc) by taking the QT interval and dividing it by the square root of the R-R interval (interval between ventricular depolarizations). This allows an assessment of the QT interval that is independent of the heart rate. Normal corrected QTc intervals are 0.44 seconds or less.
There is no distinctly visible wave representing atrial repolarization in the ECG because it occurs during ventricular depolarization. Because the wave of atrial repolarization is relatively small in amplitude (i.e., has low voltage), it is masked by the much larger ventricular-generated QRS complex.
ECG tracings recorded simultaneously from different electrodes placed on the body produce different characteristic waveforms. To learn where ECG electrodes are placed, CLICK HERE.
Revised 11/1/2023