 Cardiovascular Physiology Concepts, 3rd edition textbook, Published by Wolters Kluwer (2021)
 Normal and Abnormal Blood Pressure, published by Richard E. Klabunde (2013)
Ventricular Depolarization and the Mean Electrical Axis
Sequence of Ventricular Depolarization
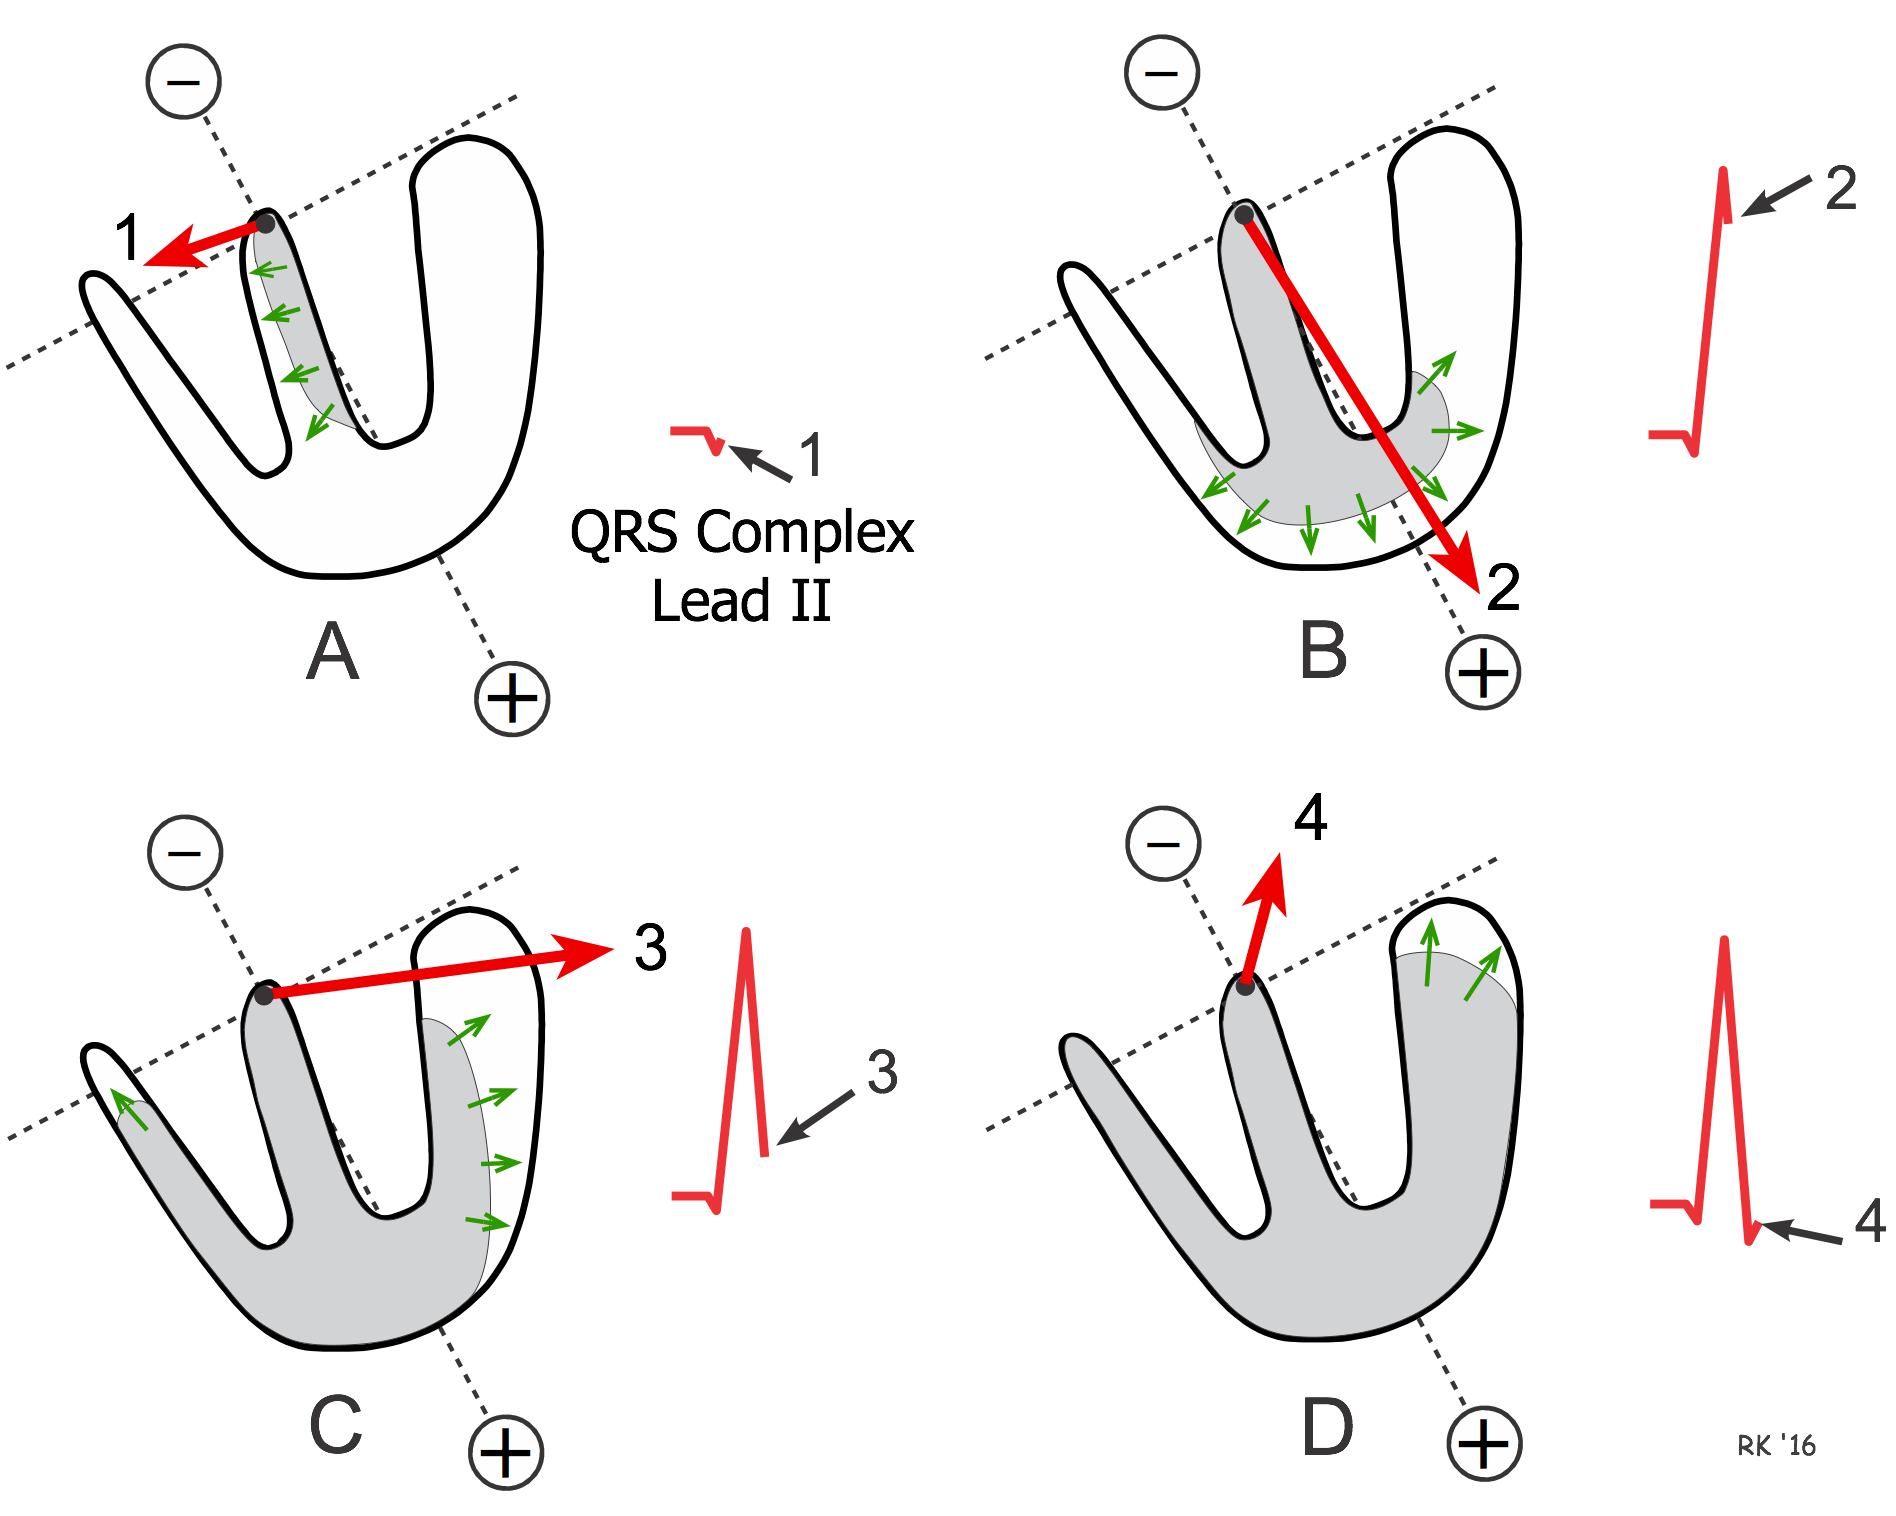 The mean electrical axis is the average of all the instantaneous mean electrical vectors occurring sequentially during depolarization of the ventricles. The figure to the right, which shows the septum and free left and right ventricular walls, depicts the sequence of depolarization within the ventricles. In this model, each of the four vectors is depicted as originating from the top of the interventricular septum, just below the AV node. The electrode placement represents lead II. During ventricular activation, impulses are first conducted down the left and right bundle branches on either side of the septum. This causes the septum to depolarize from left-to-right, as depicted by vector 1 (Panel A). This vector is heading slightly away from the positive electrode (to the right of a line perpendicular to the lead axis) and therefore will record a small negative deflection (Q wave of the QRS). About 20 milliseconds later, the mean electrical vector points downward toward the apex (vector 2), and is directed toward the positive electrode (Panel B). This produces a very tall positive deflection (R wave of the QRS). After another 20 milliseconds, the mean vector is pointing toward the left arm and anterior chest as the free wall of the ventricle depolarizes from the endocardial to the epicardial surface (vector 3, Panel C). This vector records a small positive voltage in lead II. Finally, the last regions to depolarize results in vector 4 (Panel D), which produces a slight negative deflection (S wave) of the QRS. The above sequence of ventricular depolarization takes about 100 msec (QRS duration).
 The shape of the QRS complex is different for each of the limb leads because each of the leads records the sequence of depolarization vectors from a different perspective (see axial reference system). The animated figure shows how the QRS complex appears for lead aVF and lead I. The positive electrodes for these two leads are at +90° and 0°, respectively. In this illustration, the mean electrical axis (see below) is about +60°. Note that aVF shows a large net positive QRS. There is no Q wave because septal depolarization is not directed away from the lead (see ECG rules). The R wave is very positive because early ventricular depolarization is largely directed toward this lead. The S wave is also present because the terminal depolarization of the upper wall of the left ventricle is directed away from aVF. In contrast, lead I has an initial Q wave (septal depolarization is directed away from the lead) followed by a moderately positive R wave.
The Mean Electrical Axis
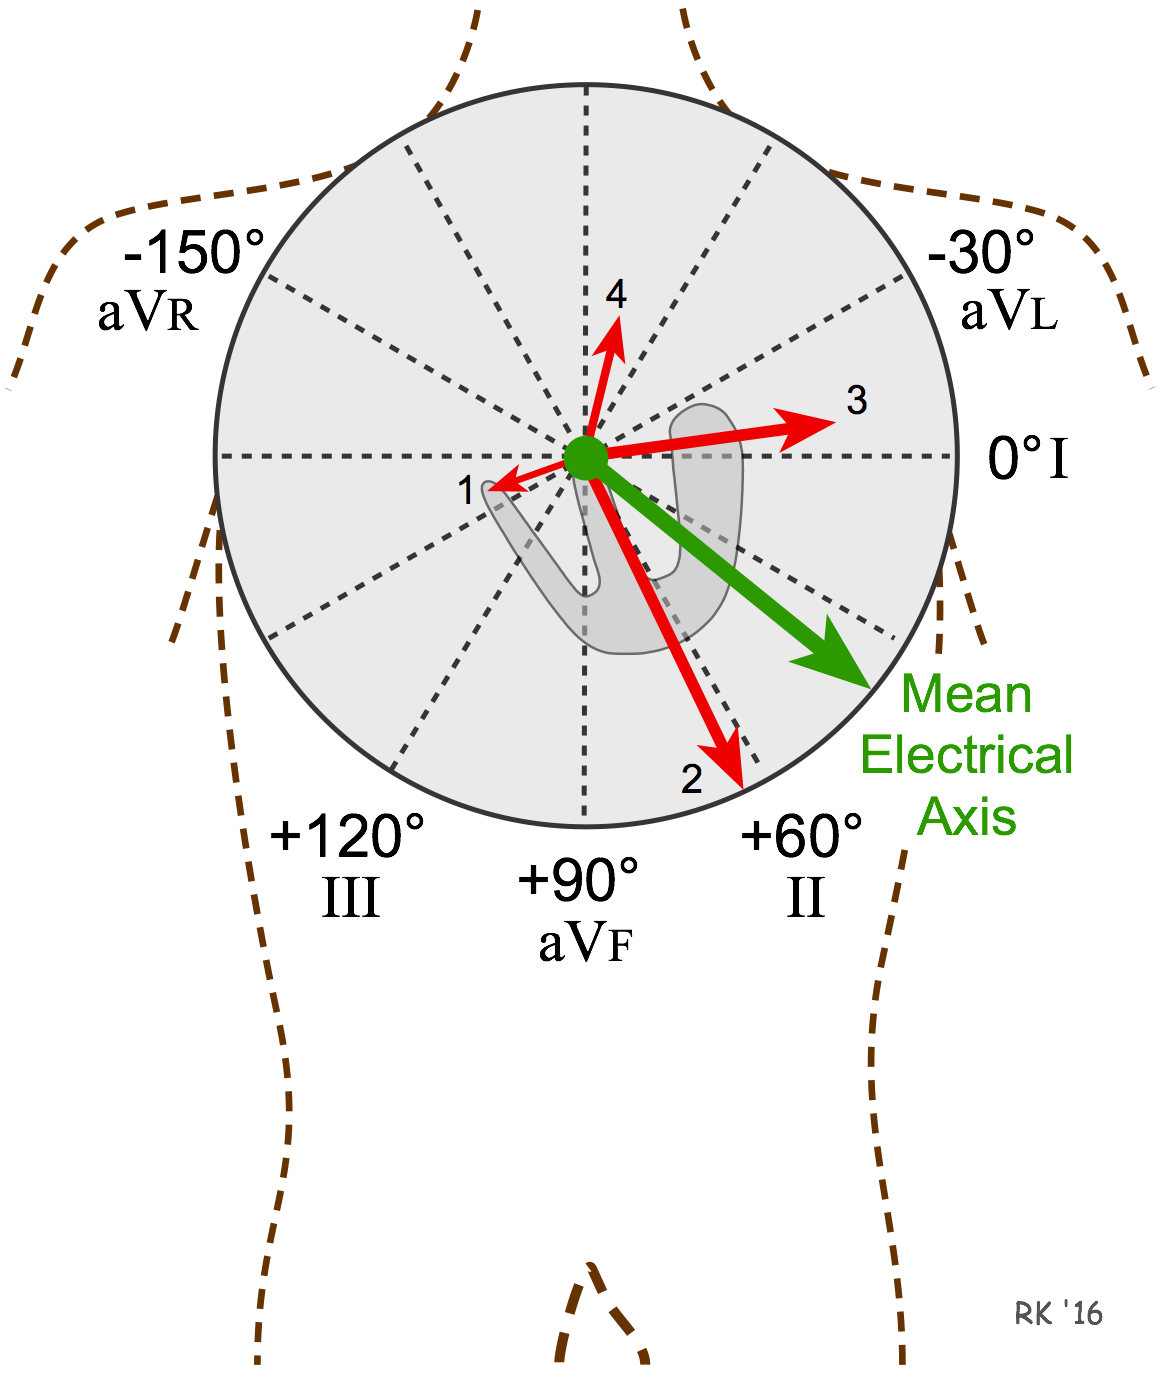 The mean electrical axis represents the sum of all the mean electrical vectors occurring during ventricular depolarization. The mean electrical axis is depicted by a green arrow in the figure. The figure also shows the same instantaneous mean vectors (red arrows) as in the previous figure, but superimposed upon the axial reference system. In this example, the mean electrical axis is approximately +40°. The mean electrical axis for the heart normally lies between -30 and +90°. Less than -30° is termed a left axis deviation and greater than +90° is termed a right axis deviation. Axis deviations can be caused by increased cardiac muscle mass (e.g., left ventricular hypertrophy), changes in the sequence of ventricular activation (e.g., conduction defects), or because of ventricular regions being incapable of being activated (e.g., infarcted tissue).
To determine the mean electrical axis from the ECG, first find the lead axis that is equally biphasic (equally positive and negative QRS deflections – i.e., no net deflection). Next, find the lead axis that is perpendicular (90°) to the biphasic lead and that has a positive net deflection.
In the six limb leads in the example below, aVL (-30°) is biphasic. The positive perpendicular axis to aVL is +60°. Therefore, the mean electrical axis is approximately +60°, which is normal. If no one lead is equally biphasic, then choose the lead that has the smallest net deflection and extrapolate to determine the approximate mean electrical axis.
By quick inspection, if the QRS complex in either lead I or II does not have a net positive deflection, then the mean electrical axis is abnormal. When both leads have a net positive deflection, then the mean electrical axis must fall between -30 and +90 degrees, which is normal.
Revised 11/02/2023