 Cardiovascular Physiology Concepts, 3rd edition textbook, Published by Wolters Kluwer (2021)
 Normal and Abnormal Blood Pressure, published by Richard E. Klabunde (2013)
Electrophysiological Changes During Cardiac Ischemia
Cellular electrophysiological changes
When coronary blood flow is inadequate to support the oxygen needs of the myocardium (i.e., an ischemic state), tissue levels of oxygen fall, which leads to cellular hypoxia. Severe and prolonged hypoxia can ultimately lead to cellular death and total loss of electrical activity. Less severe hypoxia, or hypoxia of relatively short duration, will produce electrophysiological and mechanical changes in the heart. At the cellular level, depolarization occurs by several mechanisms. Hypoxic conditions lead to diminished intracellular concentrations of ATP. Losing ATP leads to decreased activity of ATP-dependent transport systems, including the Na+/K+-ATPase pump that normally transports K+ into the cell and Na+ out of the cell. Because this pump is electrogenic, it normally produces hyperpolarizing currents. Decreased activity, therefore, leads to depolarization because of the loss of hyperpolarizing currents. More importantly, loss of pump activity prevents K+ from being pumped back into the cell so that its extracellular concentration increases as its intracellular concentration falls. This causes membrane depolarization in accordance with the Nernst equation. Decreased ATP can also affect the movement of K+ through KATP channels, which open when there is reduced ATP. This leads to an outward movement of K+, which initially can lead to hyperpolarization; however, excessive outward movement of K+ will lead to an increase in extracellular K+ and membrane depolarization. Depolarization is accompanied by reduced action potential duration, and therefore earlier repolarization.
Depolarization inactivates fast Na+ channels and decreases action potential upstroke (phase 0) velocity. This leads to decreased conduction velocity. Cellular depolarization, shortened action potentials, and decreased conduction velocity can contribute to arrhythmias that may require the use of antiarrhythmic drugs.
 T wave abnormalities
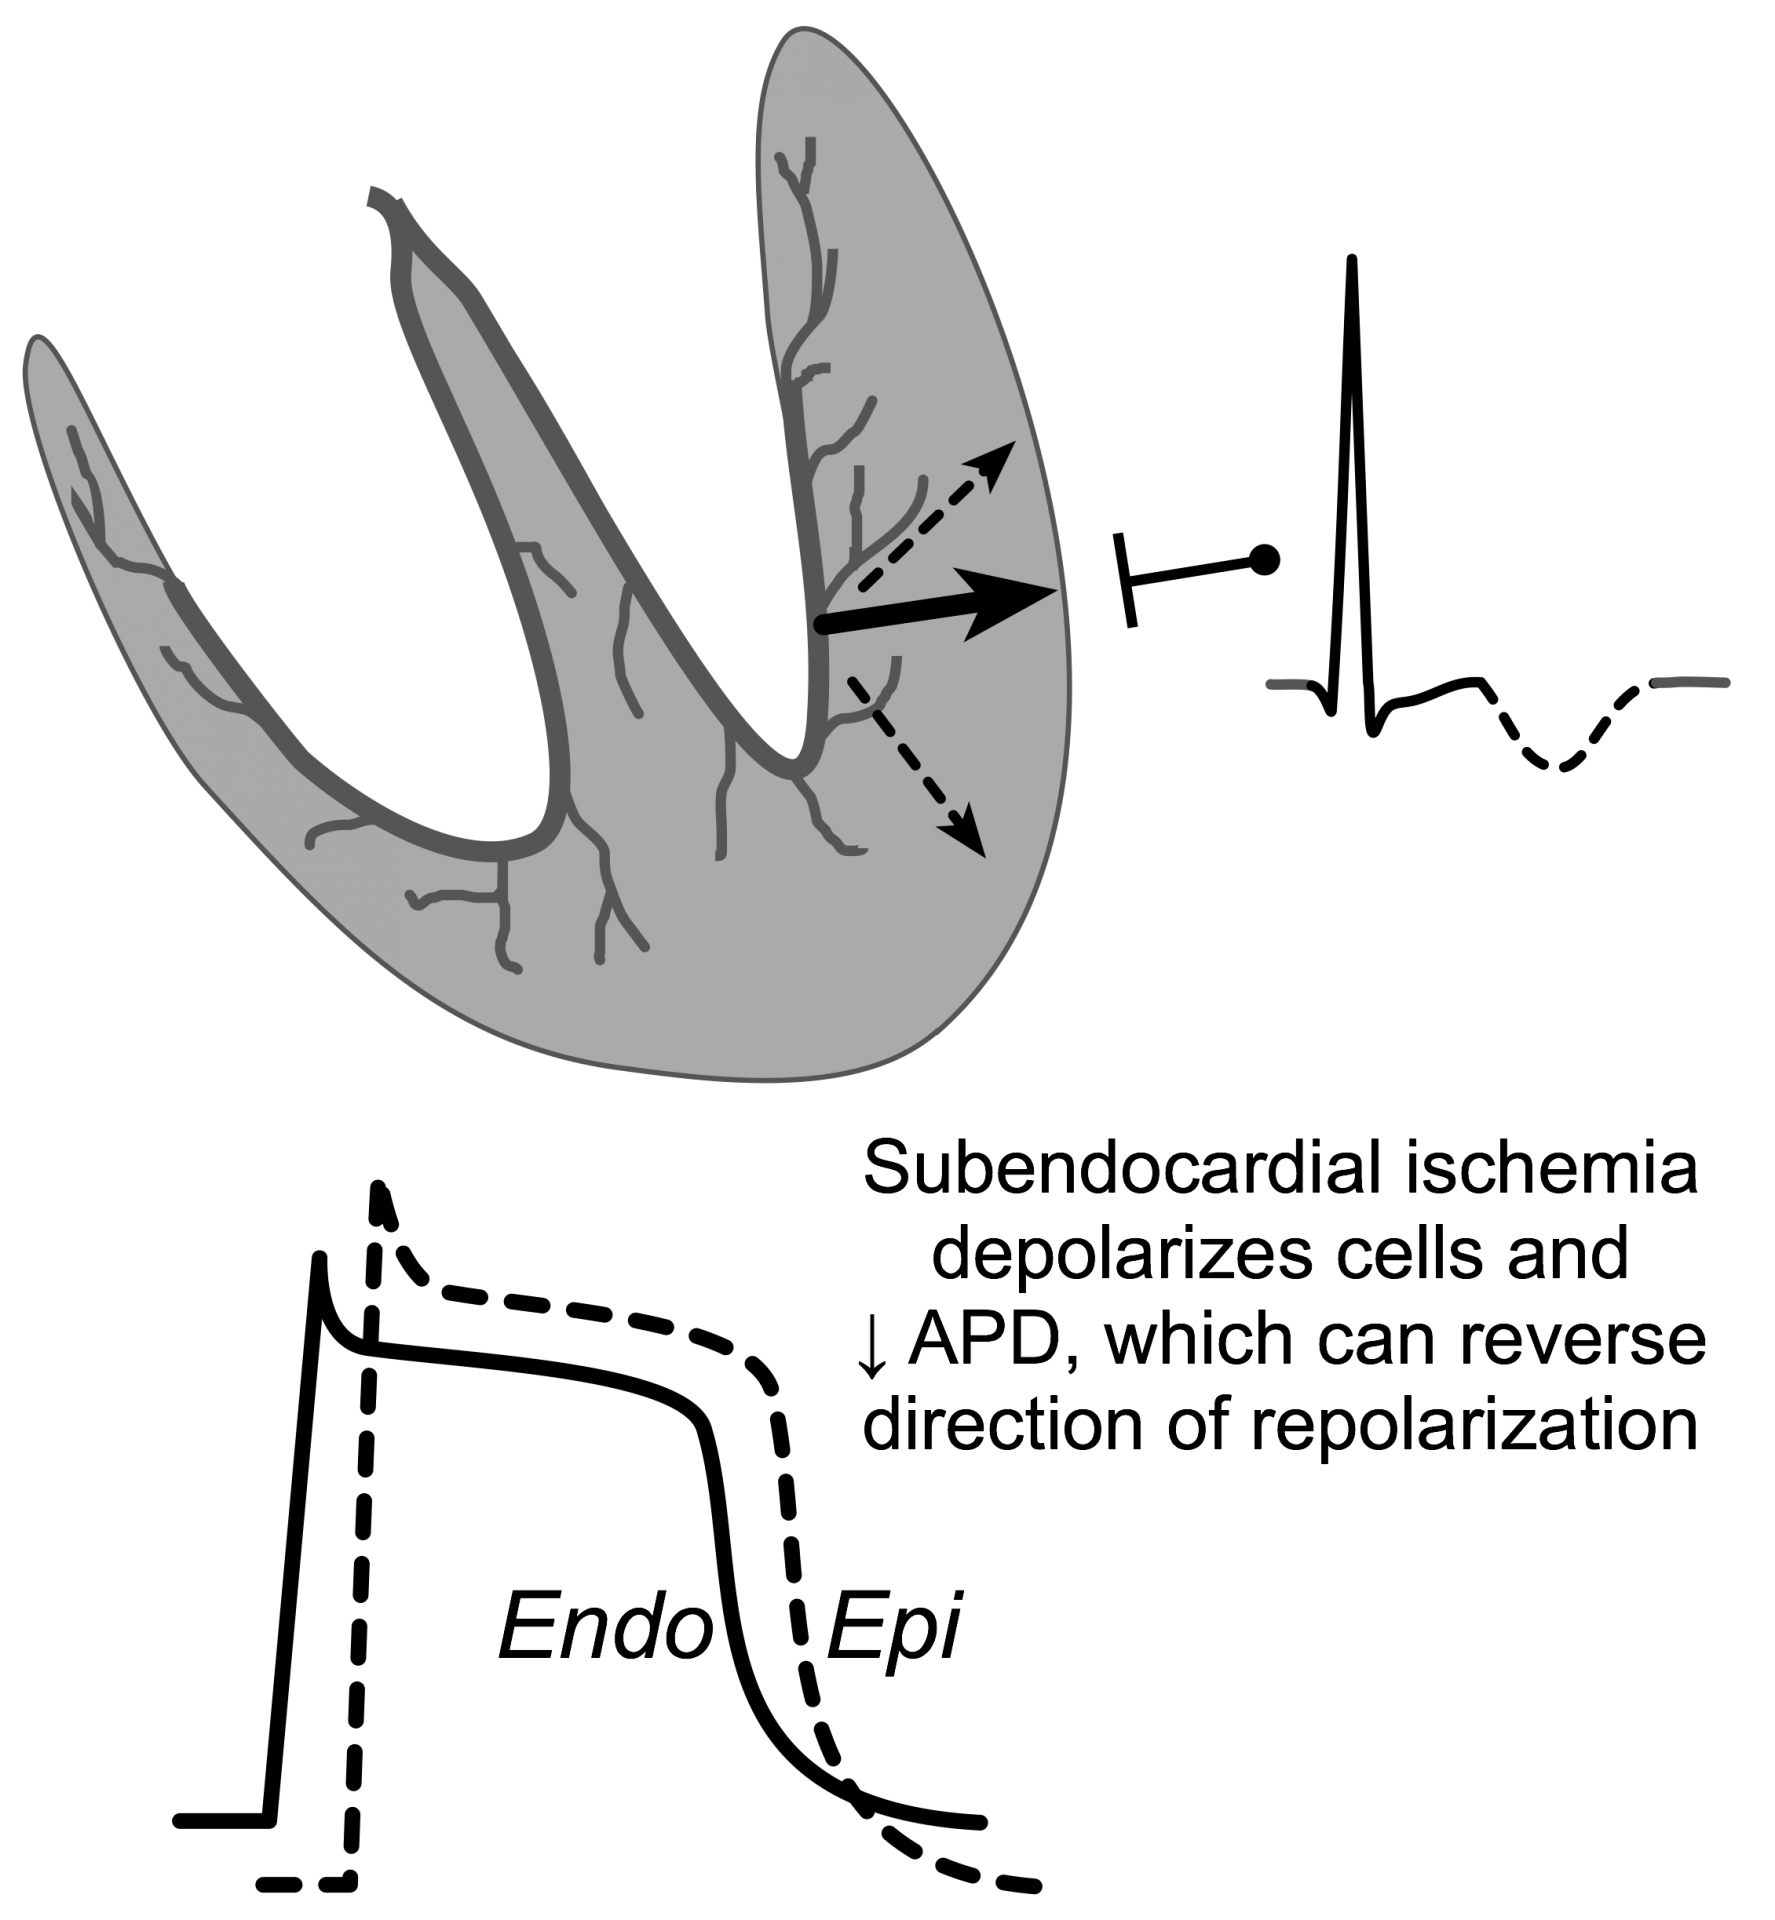
T waves are normally upright because the last ventricular cells to depolarize are subepicardial cells, which normally have a shorter duration than subendocardial cells. This shorter duration causes them to repolarize earlier than the longer action potentials found in the subendocardium. This wave of repolarization travels away from the overlying recording electrode and therefore displays a positive voltage. Subendocardial ischemia causes subendocardial (Endo in figure) cells to have a shorter action potential duration and therefore an earlier onset of repolarization. If this repolarization occurs prior to subepicardial repolarization (see figure), then the wave of repolarization will travel towards recording electrodes. This will cause an inverted T wave (dashed component of ECG tracing in figure). Inverted T waves frequently occur during myocardial ischemic events.
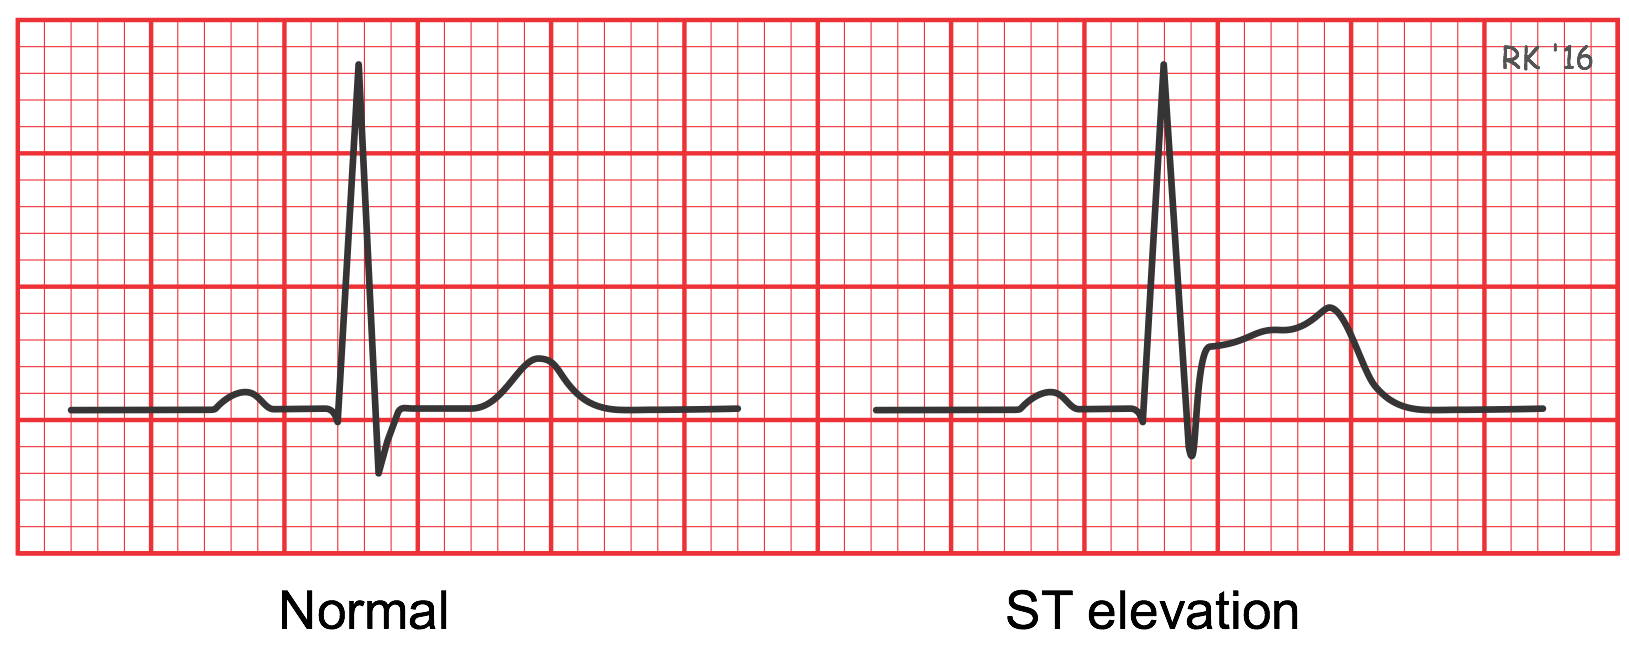
Electrocardiogram ST segment changes
Injury currents flowing from the depolarized ischemic regions to normal regions result in the appearance of ST segment elevation or depression, depending upon whether the ischemic region is subendocardial (ST depression) or transmural (ST elevation). The former is usually associated with demand ischemia (e.g., exertional angina), whereas the latter is associated with supply ischemia (e.g., coronary occlusion).
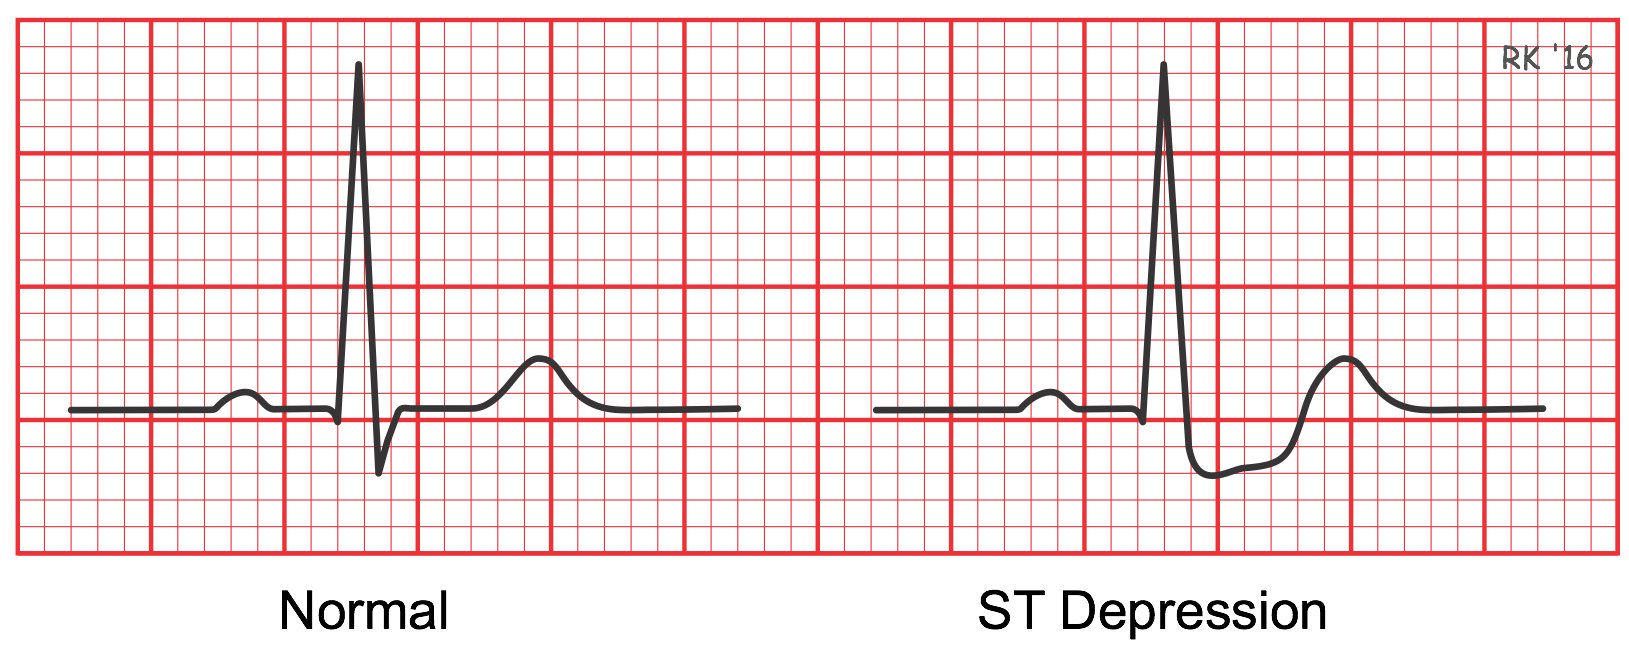
ST segment depression can be observed when a patient with suspected coronary artery disease undergoes an ECG stress test. While a 12-leaded ECG is recorded, the patient is asked to walk on a treadmill and the work level is stepped up by increasing speed and an incline to mimic exercise. If the increase in coronary blood flow is insufficient for the increase in myocardial oxygen demand, the myocardium becomes hypoxic, particularly in the ventricular subendocardium. The patient may experience symptoms of exertional angina and display an abnormal ECG. It is not uncommon to observe ST segment depression under these conditions. Although ST depression cannot be localized within the heart like acute ST elevation or Q waves of old myocardial infarctions, the ST depression indicates acute myocardial ischemia and hypoxia.
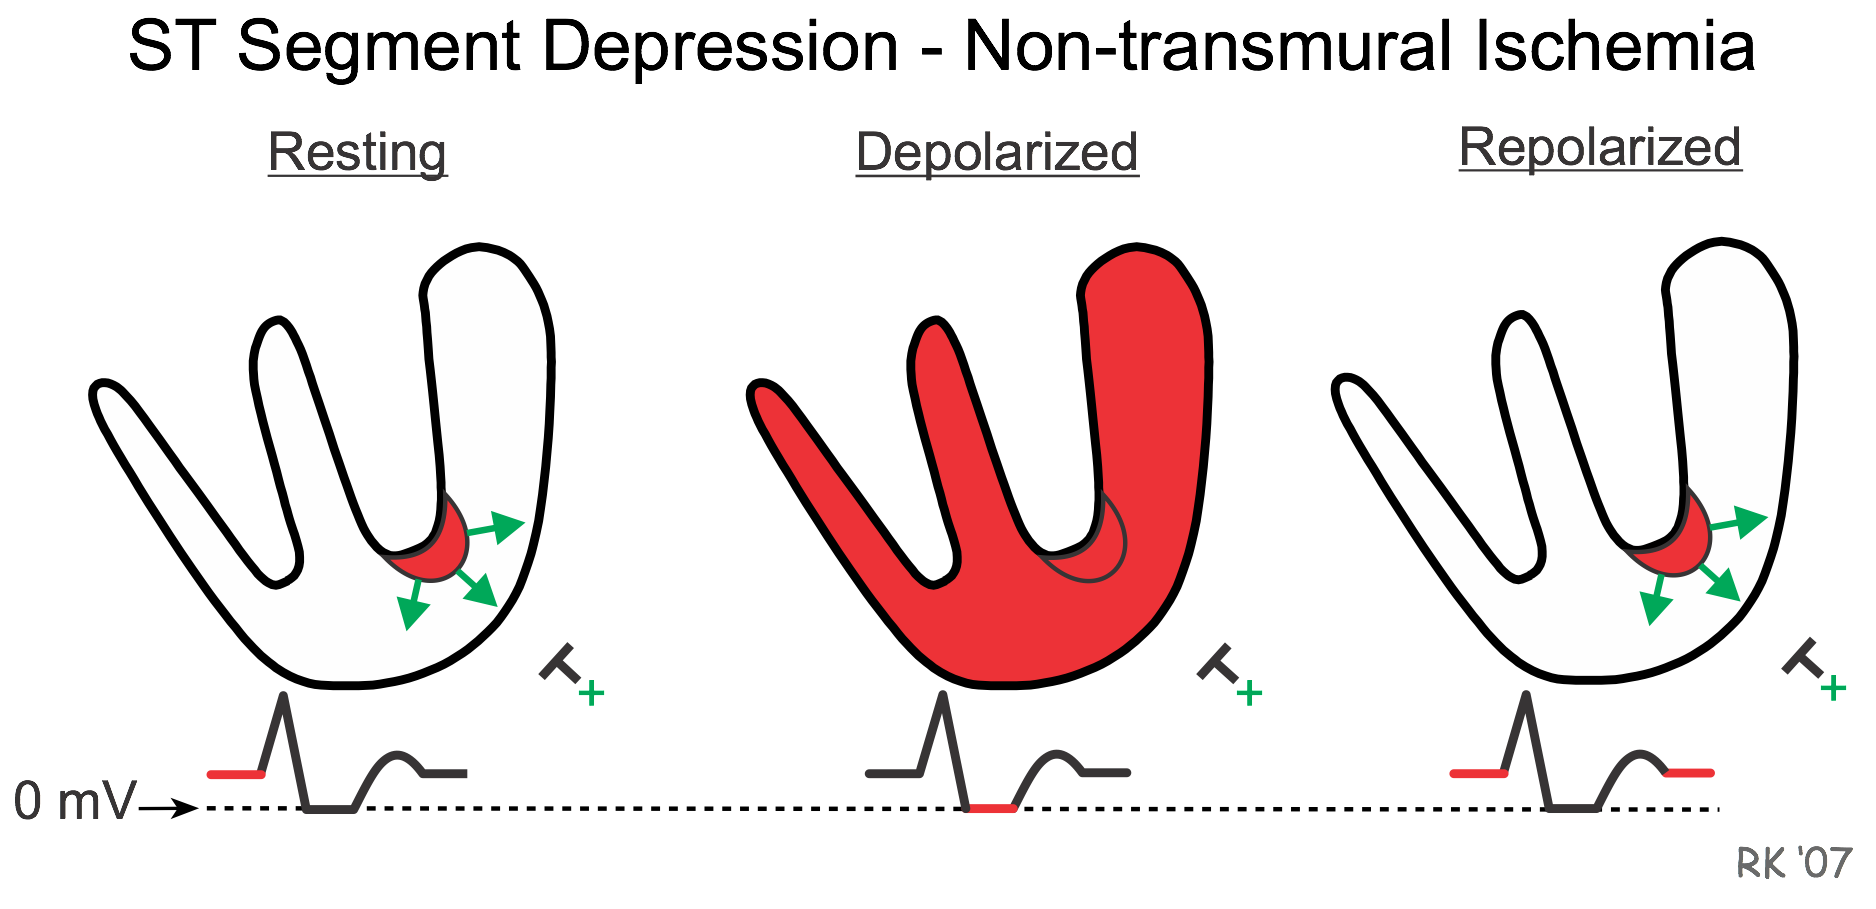
ST segment depression occurs because when the ventricle is at rest and therefore repolarized, the depolarized ischemic subendocardium generates electrical currents that are recorded by an overlying electrode. If the depolarizing currents are traveling toward a positive recording electrode, the baseline voltage prior to the QRS complex (which is normally isoelectric - i.e., zero mV) will be elevated (red line above zero prior to R wave in resting figure). In contrast, when the ventricle becomes depolarized, all the muscle is depolarized so that zero voltage is recorded by the electrode as usual. After repolarization, the voltage following the T wave (red line after the T wave) remains positive, as in the resting state. Therefore, the net effect of the elevated baseline voltage is that the ST segment appears to be depressed relative to the baseline.
Many patients undergoing a "heart attack" caused by complete thrombotic occlusion of a coronary artery will show ST segment elevation recorded by electrodes that overlie the ischemic tissue. Because this event results from complete coronary occlusion, the ischemic region and subsequent infarcted tissue span the entire thickness of the muscle wall from endocardium to epicardium (i.e., transmural ischemia). Other changes may also occur over time, especially with the T wave (e.g., T wave inversion). To be diagnostic, ST segment elevation must be at least one small square above the baseline and observed in two or more contiguous leads in order to localize the ischemic injury. For example, ST elevation in leads II, III and aVF shows inferior wall ischemia, and ST elevation in leads V5 and V6 shows left ventricular anterolateral ischemia.
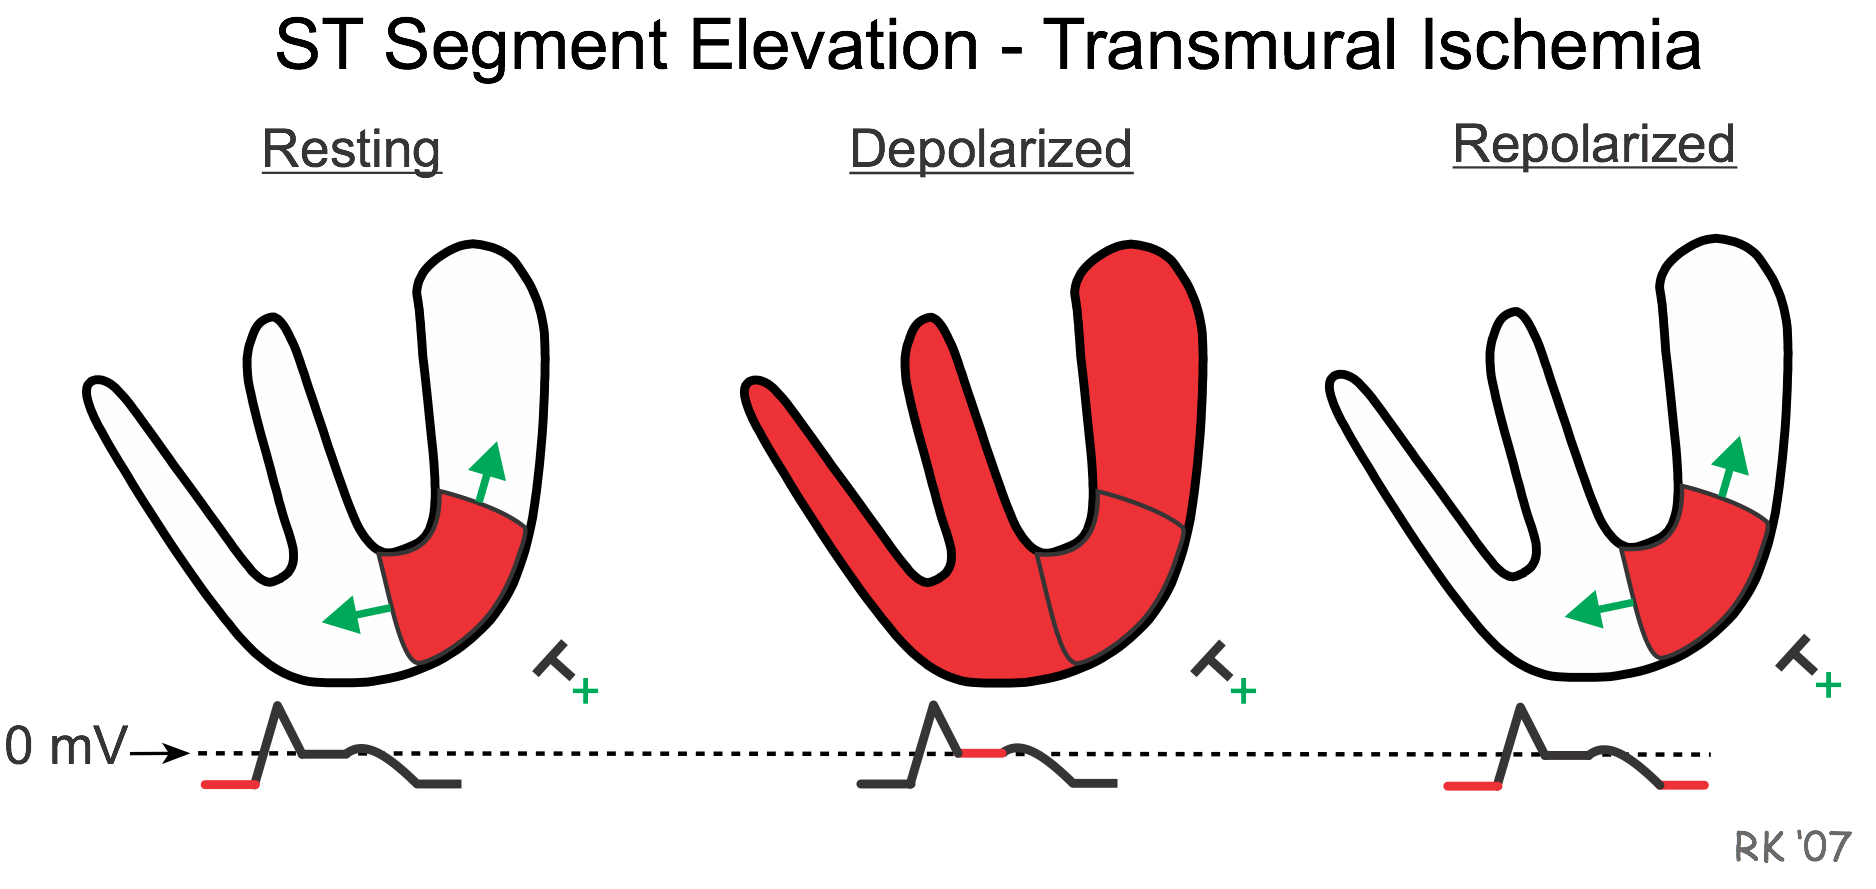
ST segment elevation occurs because when the ventricle is at rest and therefore repolarized, the depolarized ischemic region generates electrical currents that are traveling away from the recording electrode; therefore, the baseline voltage prior to the QRS complex is depressed (red line before the R wave). When the ventricle becomes depolarized, all the muscle is depolarized during the ST segment so that zero voltage is recorded by the electrode (red line after R wave). When the ventricle is completely repolarized after the T wave, the baseline is once again negative, as in the resting state. Therefore, the net effect of the depressed baseline voltage is that the ST segment appears to be elevated relative to the baseline.
Revised 01/30/2023