 Cardiovascular Physiology Concepts, 3rd edition textbook, Published by Wolters Kluwer (2021)
 Normal and Abnormal Blood Pressure, published by Richard E. Klabunde (2013)
Cardiac Cycle
 There are two basic phases of the cardiac cycle: diastole (relaxation and filling) and systole (contraction and ejection).
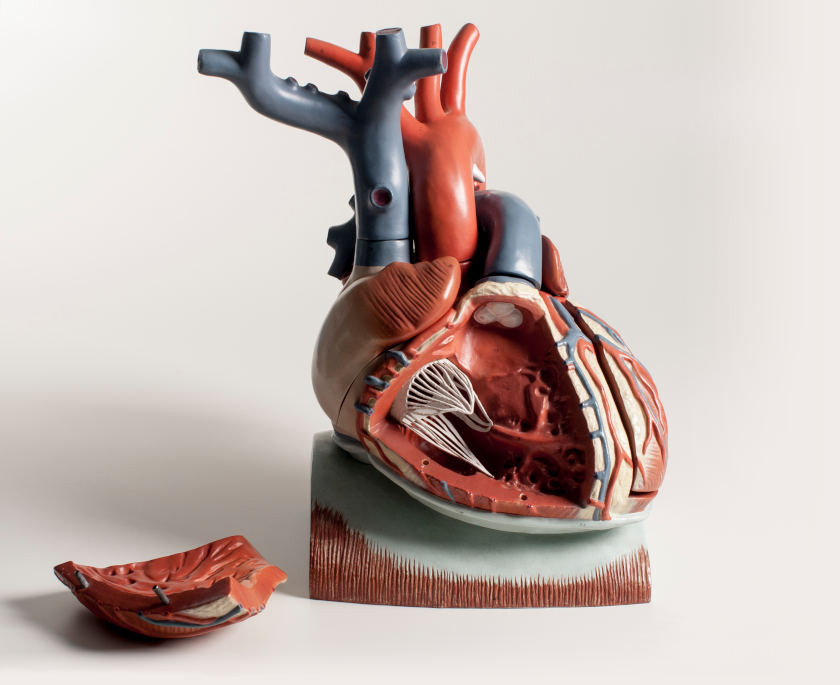
Diastole represents the period when the ventricles are relaxed (not contracting). Throughout most of this period, blood is passively flowing from the left atrium (LA) and right atrium (RA) into the left ventricle (LV) and right ventricle (RV), respectively (see figure). Blood flows through atrioventricular valves (mitral and tricuspid) that separate the atria from the ventricles. The RA receives venous blood from the body through the superior vena cava (SVC) and inferior vena cava (IVC); the LA receives oxygenated blood from the lungs through four pulmonary veins that enter the LA. At the end of the diastole, both atria contract, which propels an additional amount of blood into the ventricles.
Systole represents the time during which the left and right ventricles contract and eject blood into the aorta and pulmonary artery, respectively. During systole, the aortic and pulmonic valves open to permit ejection into the aorta and pulmonary artery. The atrioventricular valves are closed during systole; therefore, no blood is entering the ventricles; however, blood continues to enter the atria though the vena cavae and pulmonary veins.
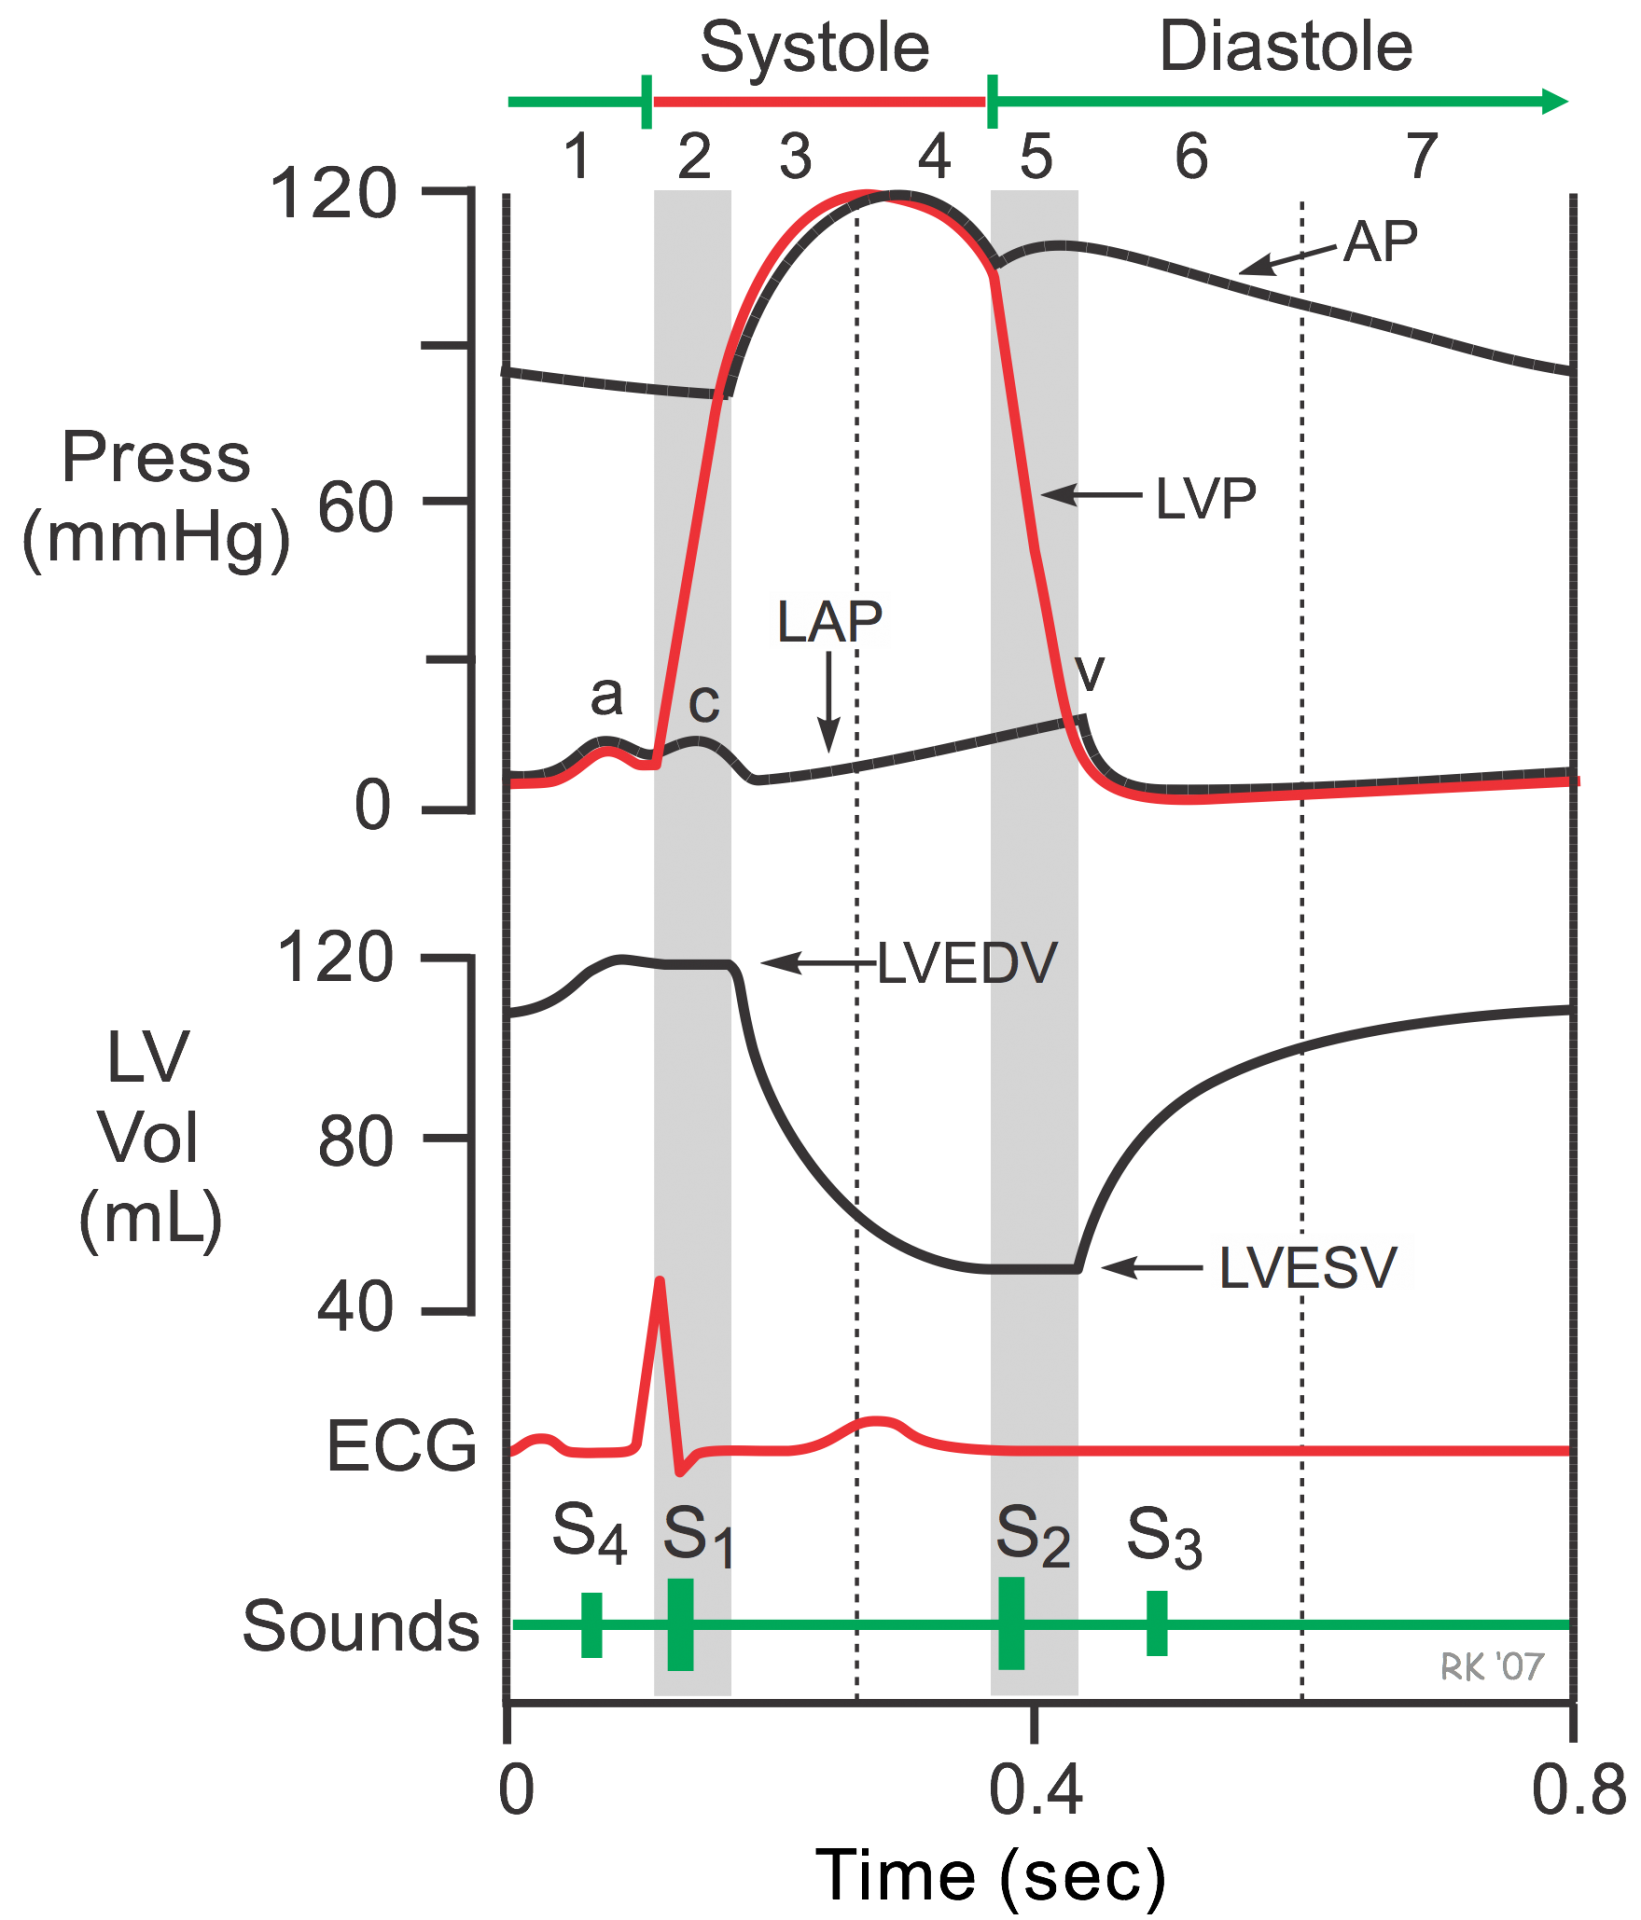 The cardiac cycle diagram (see figure) depicts changes in aortic pressure (AP), left ventricular pressure (LVP), left atrial pressure (LAP), left ventricular volume (LV Vol), and heart sounds during a single cycle of cardiac contraction and relaxation. These changes are related in time to the electrocardiogram. An online video and tutorial of the cardiac cycle from the Health Education Assets Library is available: cardiac cycle video.
Aortic pressure is measured by inserting a pressure-measuring catheter into the aorta from a peripheral artery, and the left ventricular pressure is obtained by placing a catheter inside the left ventricle and measuring changes in intraventricular pressure as the heart beats. Direct measurement of left atrial pressure by a catheter is rarely conducted; however, left atrial pressure can be indirectly estimated by recording the pulmonary capillary wedge pressure. Ventricular volume changes are assessed in real time using echocardiography or radionuclide imaging, or by using a special volume conductance catheter placed within the ventricle.
To analyze systole and diastole in more detail, the cardiac cycle is usually divided into seven phases. The first phase begins with the P wave of the electrocardiogram, which represents atrial depolarization and is the last phase of diastole. Phases 2-4 represent systole, and phases 5-7 represent early and mid-diastole. The last phase of the cardiac cycle ends with the appearance of the next P wave, which begins a new cycle.
Detailed descriptions of each phase can be obtained by clicking on each of the seven phases listed below.
- Phase 1 - Atrial Contraction
- Phase 2 - Isovolumetric Contraction
- Phase 3 - Rapid Ejection
- Phase 4 - Reduced Ejection
- Phase 5 - Isovolumetric Relaxation
- Phase 6 - Rapid Filling
- Phase 7 - Reduced Filling
Mini-Lecture: Cardiac Cycle (Time = 14 min) (CLICK HERE)
Revised 11/04/2023