 Cardiovascular Physiology Concepts, 3rd edition textbook, Published by Wolters Kluwer (2021)
 Normal and Abnormal Blood Pressure, published by Richard E. Klabunde (2013)
Determining Heart Rate from the Electrocardiogram
The term "heart rate" normally refers to the rate of ventricular contractions. However, because there are circumstances in which the atrial and ventricular rates differ (e.g., second and third degree AV block), it is important to determine both atrial and ventricular rates. This is easily done by examining an ECG rhythm strip, which is usually taken from a single lead (e.g., Lead II). In the example below, there are four numbered R waves, each of which is preceded by a P wave. Therefore, the atrial and ventricular rates will be the same because there is a one-to-one correspondence. Atrial rate can be determined by measuring the time intervals between P waves (P-P intervals). Ventricular rate can be determined by measuring the time intervals between the QRS complexes, which is done by looking at the R-R intervals.
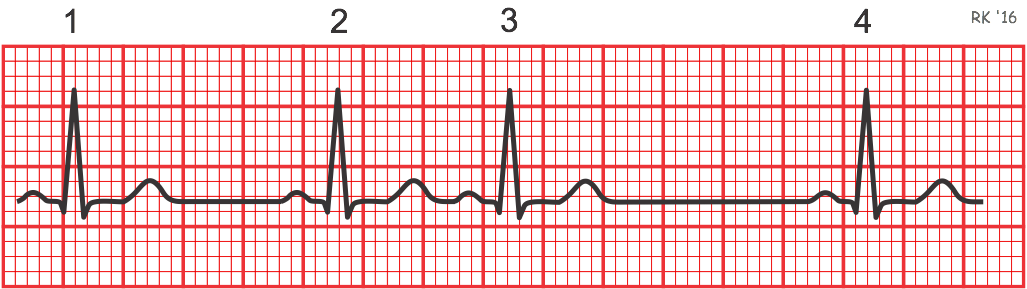
There are different short-cut methods that can calculate rates, all of which assume a recording speed of 25 mm/sec, which corresponds to 5 large squares (dark red boxes) in the ECG recording. With this recording standard, the time dimension (width) of each large square represents 0.2 sec and each small square represents 0.04 sec.
One method is to divide 1500 by the number of small squares between two R waves. For example, the rate between beats 1 and 2 in the above tracing is 1500/22, which equals 68 beats/min. Alternatively, one can divide 300 by the number of large squares, which is 300/4.4 (68 beats/min). Another method, which gives a rough approximation, is the "count off" method. Count the number of large squares between R waves with the following rates: 300 - 150 - 100 - 75 - 60. For example, if there are three large boxes between R waves, then the rate is 100 beats/min. One must extrapolate, however, between boxes. Atrial rate can be determined like the ventricular rate, but using the P waves. Remember, if the heart is in sinus rhythm and there is a one-to-one correspondence between P waves and QRS completes, then the atrial rate will be the same as the ventricular rate. The rate is normal if the interval lies between 5 and 3 large squares (60 – 100 beats/min). Intervals less than 3 large squares or greater than 5 large squares represent tachycardia or bradycardia, respectively.
In the above examples, the ventricular rate was determined based on the interval between the first two beats. However, the rate would have been faster had it been calculated using beats 2 and 3 (104 beats/min) because of a premature atrial beat, and slower if it had been calculated between beats 3 and 4 (52 beats/min). This illustrates an important point when calculating the rate between any given pair of beats. If the rhythm is not regular, it is necessary to determine a time-averaged rate over a longer interval (e.g., over ten seconds or longer). For example, because the recording timescale is 25 mm/sec, if there are 12.5 beats in 10 seconds (50 large squares), the rate will be 75 beats/min (1.25 beats/sec X 60 sec/min).
Revised 11/03/2023